The perfect math project for February is ready for your classroom!
When February rolls around, I always long for a little break in the regular math routine. Don’t you?
A fun way to make that happen is to spend a week immersed in data and graphing standards through a super-engaging math simulation called Val’s Heart Factory. If your schedule allows for it, you may even select a week right around Valentine’s Day!
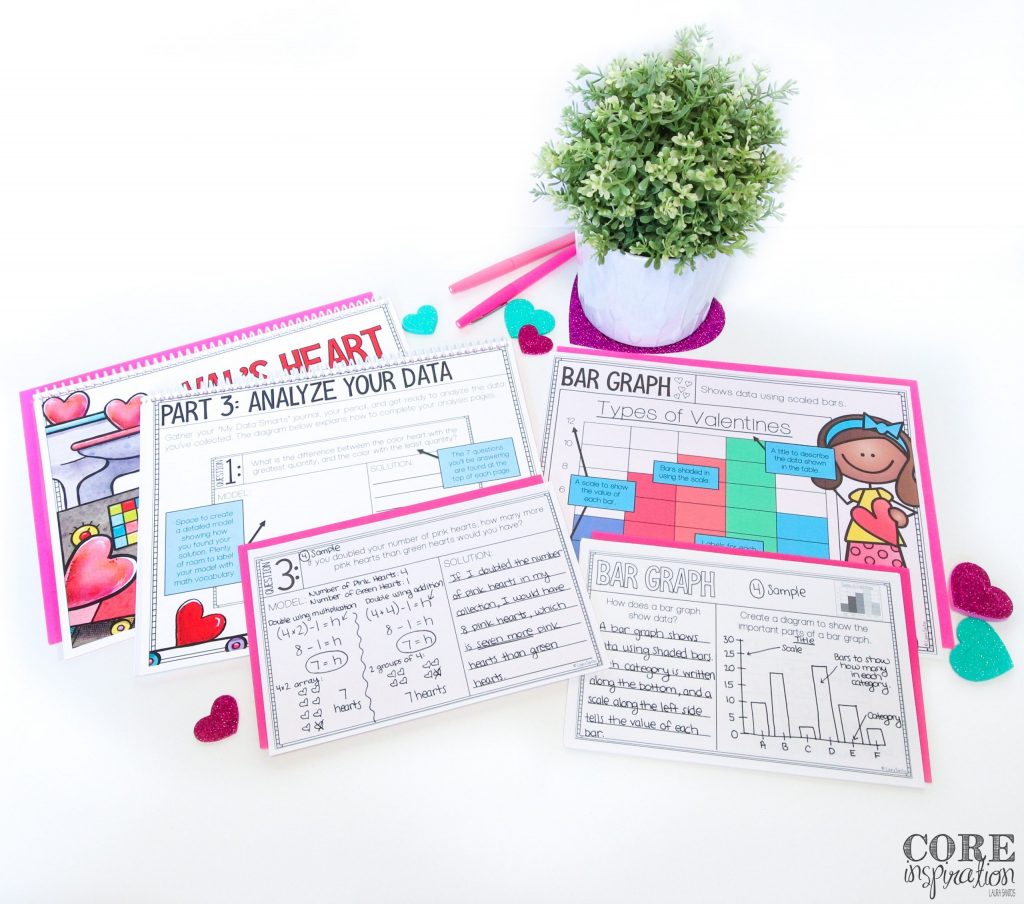
This resource is perfect for third grade classrooms, but can also be used as enrichment for second grade learners.
Let’s take a closer look at this data & graphing project based learning resource.
Project Overview
This simulation introduces your students to four methods for displaying data: frequency tables, bar graphs, pictographs and line plots. Students will have the opportunity to record observations about each method for displaying data and compare/contrast methods for collecting data.
They will use this knowledge to solve a problem for Val’s Heart Factory. The factory is having some trouble with their production line…the number of hearts being added to each of their boxes/bags of hearts is unequal. Your students will work through a series of increasingly-challenging data-focused steps to help the factory solve their problem.

Math Skills Students Will Practice During This Data & Graphing Project
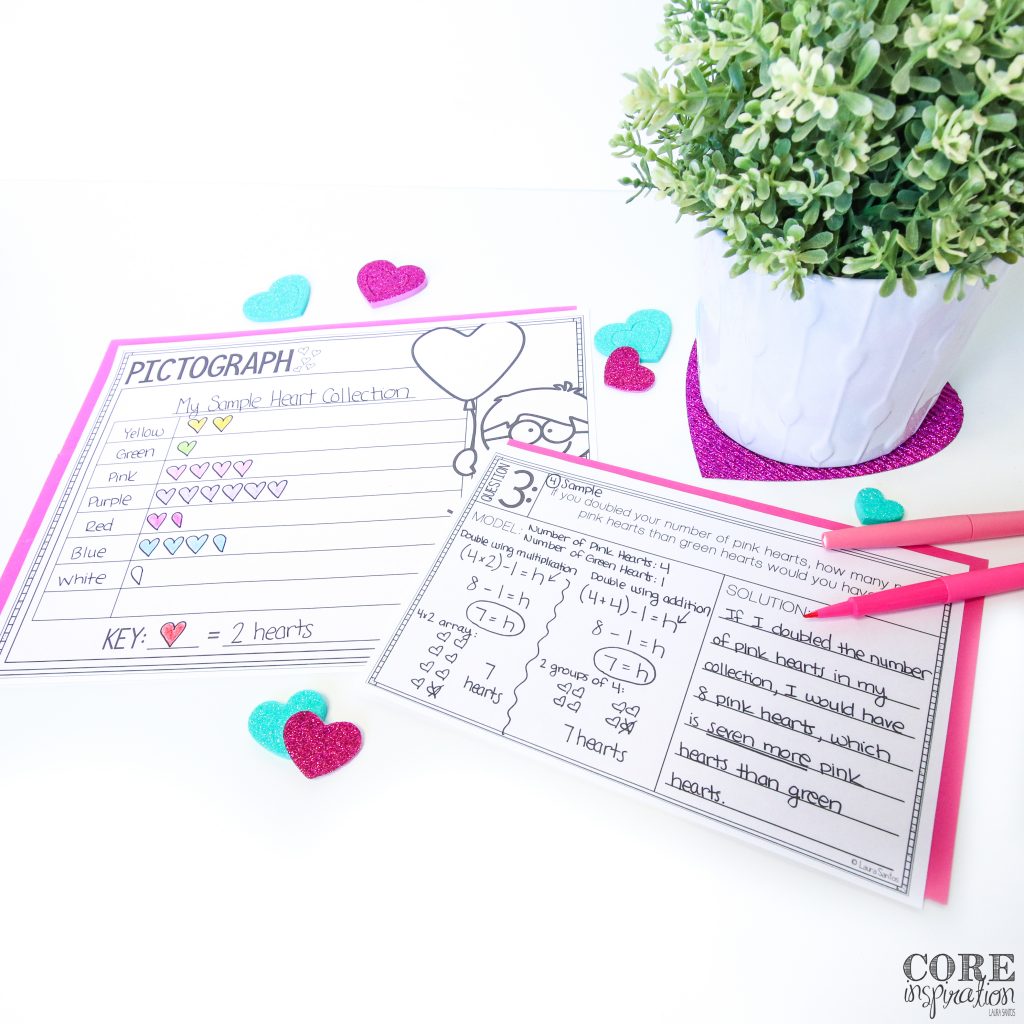
The focus of this math project based learning unit is on third grade data and graphing standards. During the project students will draw a scaled picture graph, a scaled bar graph, a pictograph, and create a frequency table to represent a data set with several categories.
Students solve one-step and two-step “how many more” and “how many less” data problems using information presented in the graphs they create. In addition, students will solve put-together, take-apart, and compare problems using information presented in their graphs.
Val’s Heart Factory Project Steps
Here are the steps your students will work through to help the factory solve their problem:
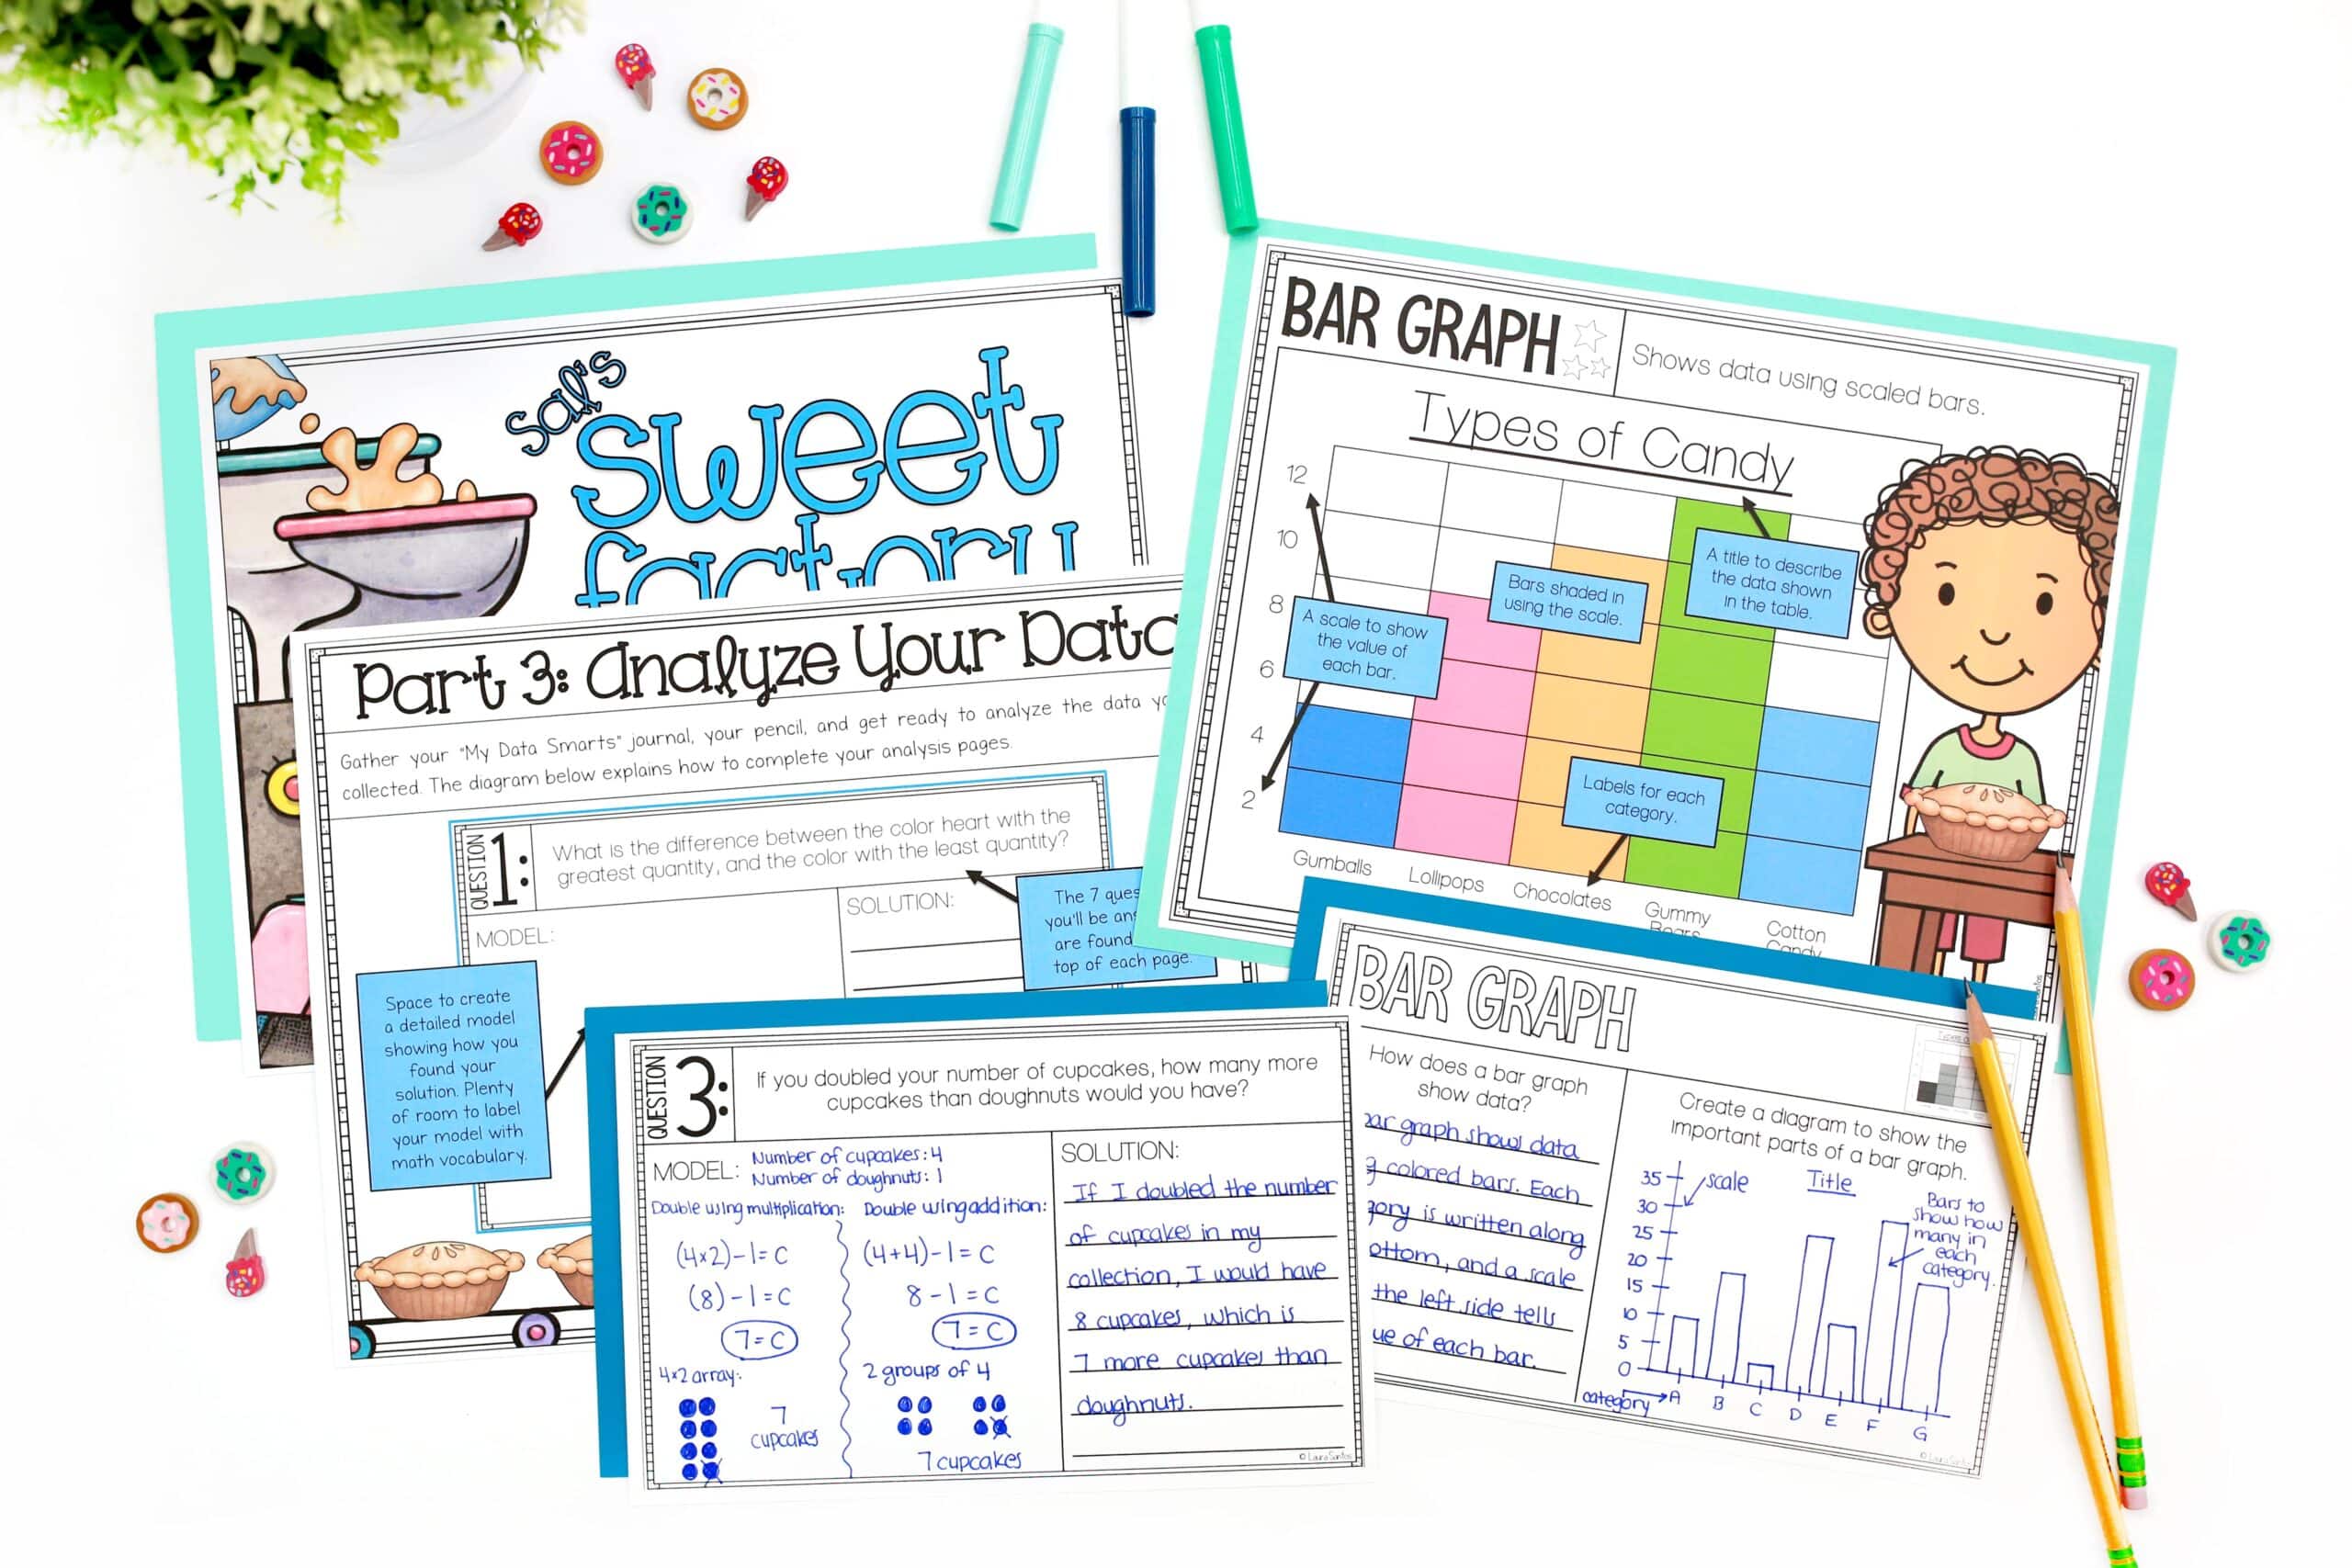
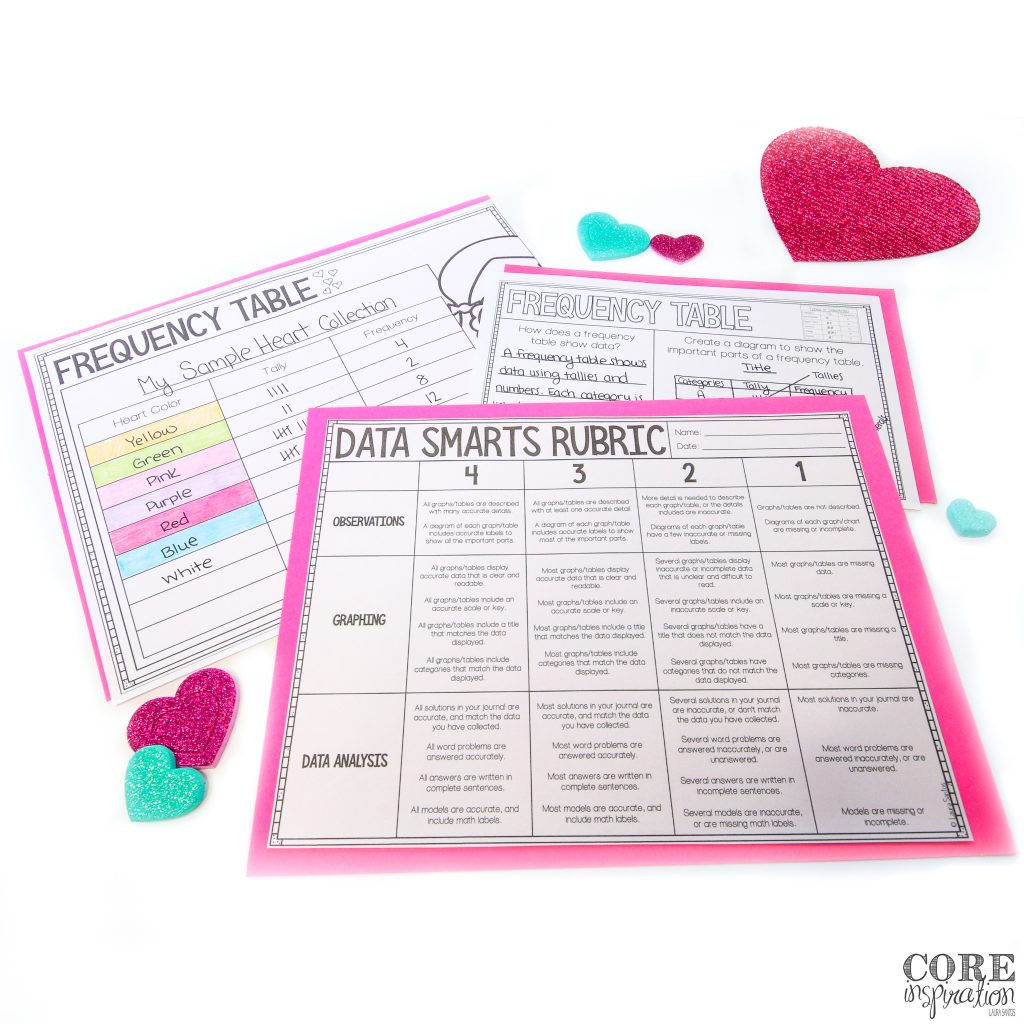
★ STEP 1: Learn about different methods for collecting and displaying data. Students will visit different stations where bar graphs, pictographs, frequency tables, and line plots are displayed on mini posters. As students visit each station, they will take notes about the different methods for displaying data in the “My Data Smarts” notebook.
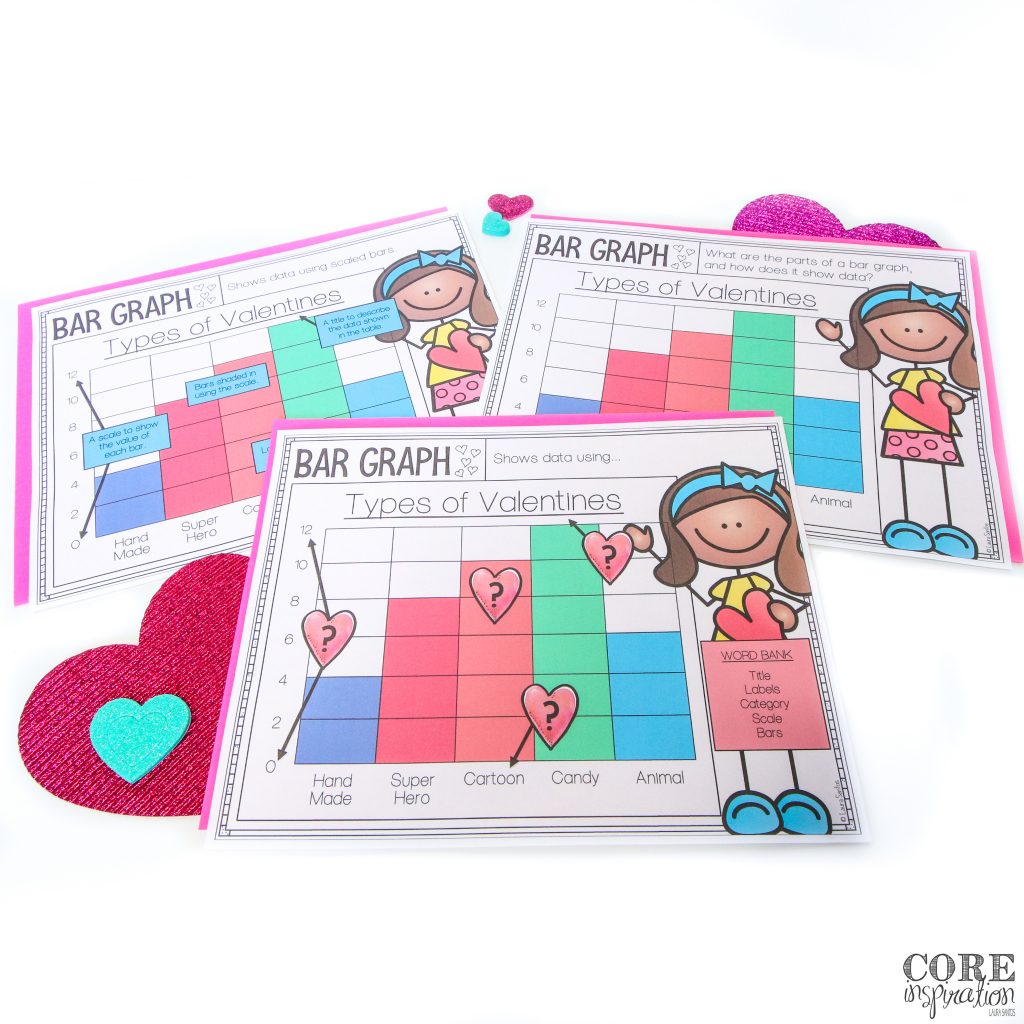
The unique posters at each station have three layers that make it easy to differentiate as you introduce students to the different types of graphs.
- The top layer shows an unlabeled example that allows students to think and observe what they notice about each type of graph.
- The middle layer has guiding questions and a word bank students can use to improve their notes.
- The bottom layer shows a labeled diagram of each type of graph/chart that helps students check their observation notes before moving on to the next station.
★ STEP 2: Gather a sample collection of hearts from the factory (a box/bag of paper, foam, or candy hearts provided by you for the print version or the included digital sample for Google Classroom version).
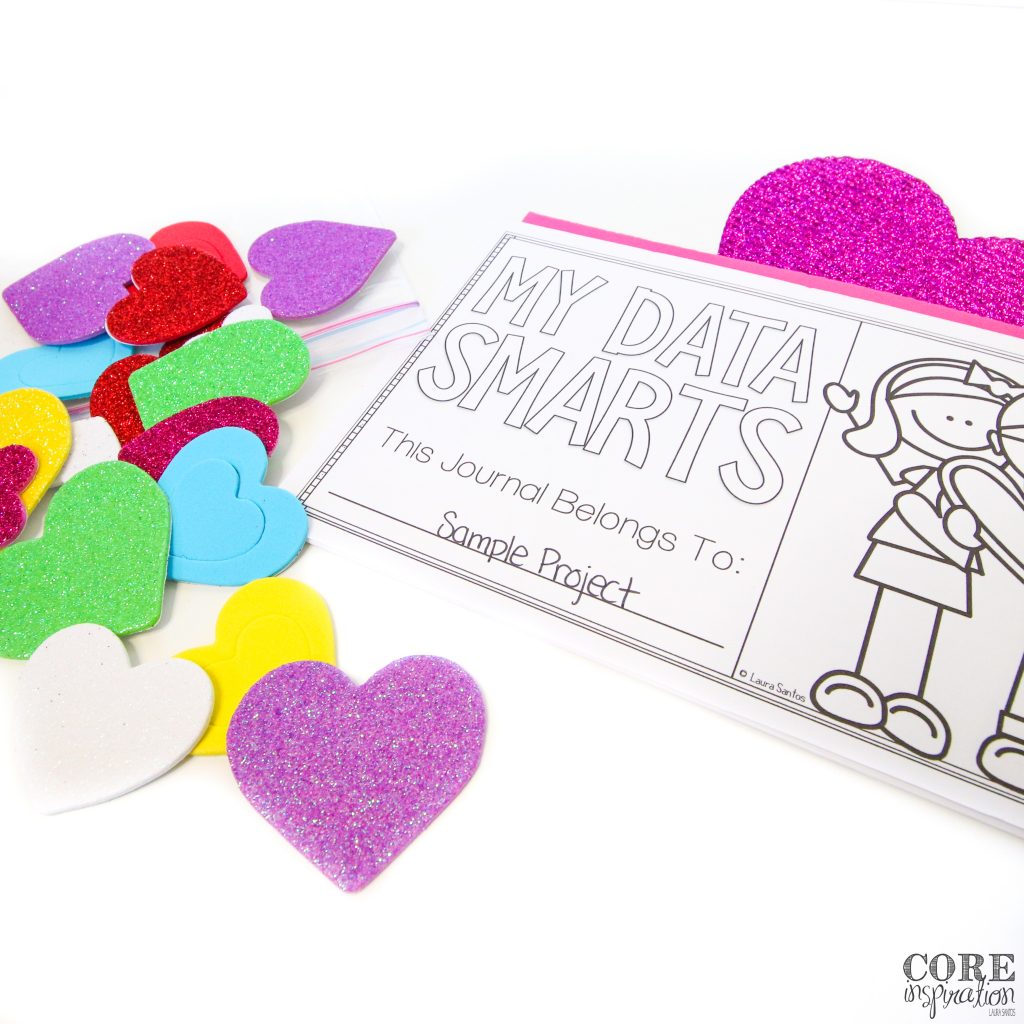
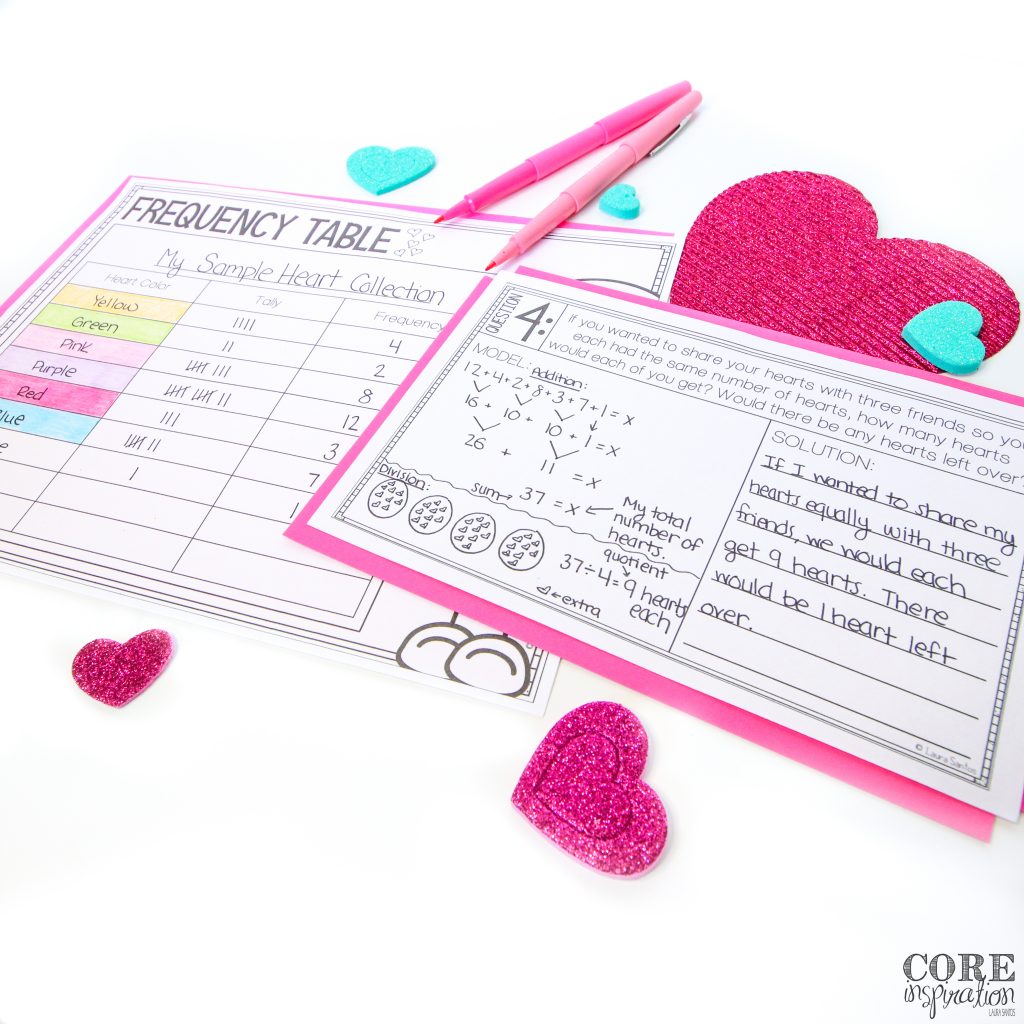
★ STEP 3: Record the number of each color heart from their sample on a frequency table. Then, display their data in multiple ways using a pictograph, bar graph and line plot.
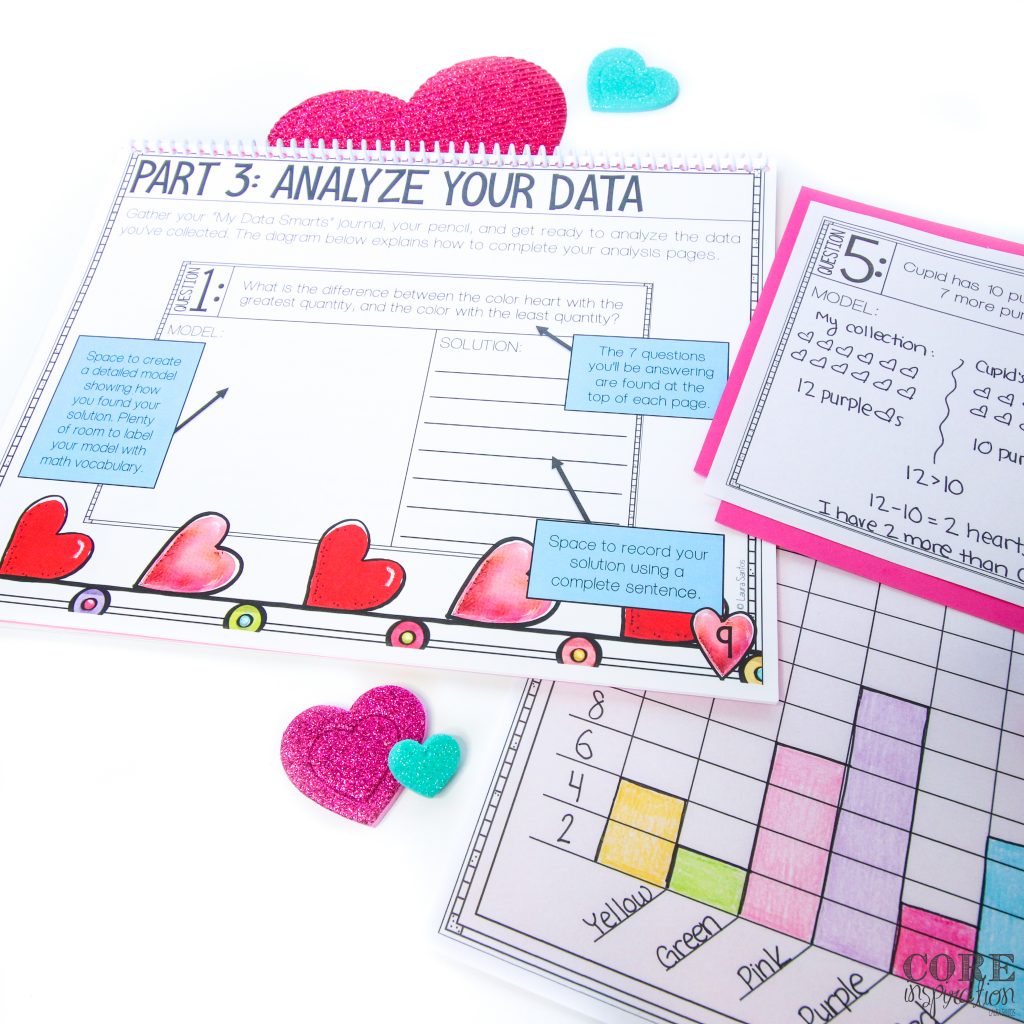
★ STEP 4: Analyze their data by answering questions that require them to refer to the various tables and graphs they’ve created & propose a solution for Val’s Heart Factory. Each question is increasingly more challenging to build students’ data analysis skills.
During this step students must use detailed models to solve each word problem and write their solutions using complete sentences. Each word problem is organized in their “My Data Smarts” notebook with plenty of space for modeling and problem solving that will give you insight into their level of understanding for data & graphing concepts.
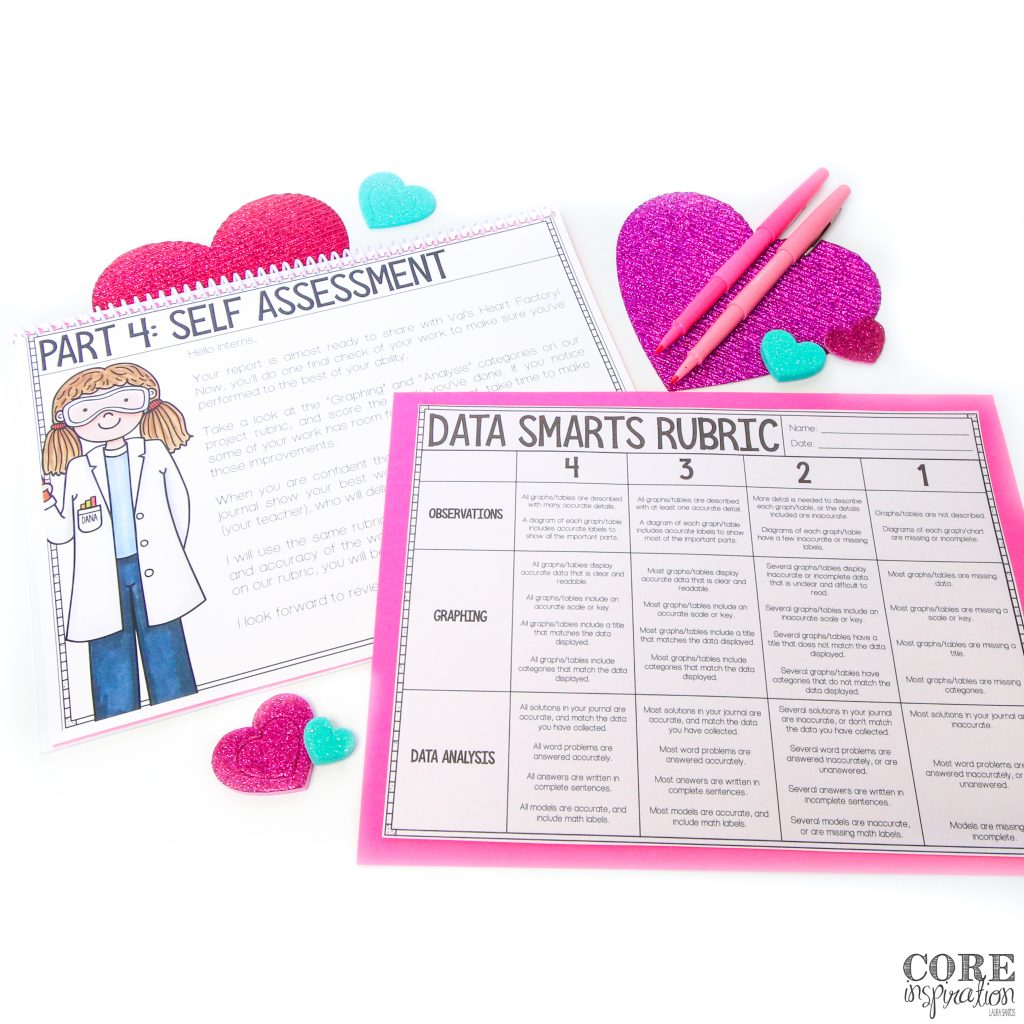
★ STEP 5: Complete a self-assessment using a four-point rubric. Each of the project deliverables is included on the rubric so students can participate in a very specific and fair assessment process as they demonstrate their learning.
Saving You Time & Making Differentiation Possible
Want to incorporate a project into your data and graphing unit, but crunched for instructional time?
This resource makes prepping for project based learning a breeze and makes implementation seamless. The detailed visual instructions on each page of the guide make it possible for students to complete their unique project with maximum independence so you have the time you need to teach or reteach important data & graphing skills to small groups while the rest of your class is plugging away on their project.
Scoring and providing students with feedback is also a breeze when using the included rubric. Each of the three project phases: observation, graphing and data analysis has its own section on the rubric so students can participate in the assessment process as they demonstrate learning, and you can provide them with specific feedback about their work.
Ideas for Using This Geometry Project Based Learning Guide
Every step of the Val’s Heart Factory experience is outlined in a project guide that includes clear visuals and step-by-step instructions. Rubrics and reflection prompts will encourage your students to reach their learning goals.
The format of this math project based learning unit makes it an ideal resource for:
★ At your seat & hands on enrichment during math workshop or guided math
★ Math center work
★ Digital learning (a Google Slides version of the entire project is included)
★ Parent volunteer or teacher’s aide enrichment station
★ A focal point for a graphing room transformation
★ A focal point for your standards-aligned Valentine’s Day celebration
★ An alternative assessment that allows you to measure student understanding on a deeper level as a culmination to your data and graphing unit.
Bring This Data & Graphing Project to Your Classroom
Whether you’re looking to bring a little life to your graphing unit, or you want to celebrate Valentine’s Day while sticking to the standards, you and your students will love Val’s Heart Factory!
Visit the resource page to see a full preview so you can learn more about this fun math project.
If you have any questions about Val’s Heart Factory, let me know in the comments below.
